In my last post I illustrated the performance boost generated by using matrix operations to conduct least squares regression calculations. Matrices by their nature require numerical data. So what about handling a categorical predictor variable? To do this it’s necessary to create dummy variables – separate variables for each unique level of the predictor variable.
I’ve written some code to do this, and I want to compare the matrix approach with a simpler approach of using the Oneway platform.
The code is shown below. My interest in this post is not to explain the detail of the code but do discuss a couple of approaches to investigating relative execution performance.

Lines 35 is the least squares formula in matrix form from which I can compute the R2 value in line 36. Lines 27 to 34 create the required X and Y matrices. Lines 7 to 26 are the steps for preparing the dummy variables.
Lines 41 to 49 use the Oneway platform to retrieve the R2 value.
Notice that on lines 5, 39 and 51 I use the Tick Seconds() function. This creates a timestamp. At the end of the script I show two values: (t2-t1) which gives me the total duration for the matrix implementation and (t3-t2) for the implementation using Oneway.
So which is quicker?
Here is the log window output:
R2Value = 0.649664102094521;
R2ow = 0.649664102094523;
t2 - t1 = 2.48333333333721;
t3 - t2 = 0.166666666686069;
The matrix calculation takes about 15 times longer than simply using the Oneway platform!
Does it matter? In this example – no. It makes no noticeable difference to me whether I wait a fraction of a second or 2 seconds. But I have some data with about 12,000 rows and some of my categorical variables have over 500 levels. For these variables the matrix calculation takes over 6 minutes.
I’m curious to understand why it is taking so long. I could drill-down on the code by including additional timestamps. But there is a better way.
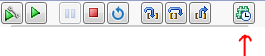
The JSL Debugger includes a JSL Profile tool:
The JSL profile gives me line-by-line performance information:
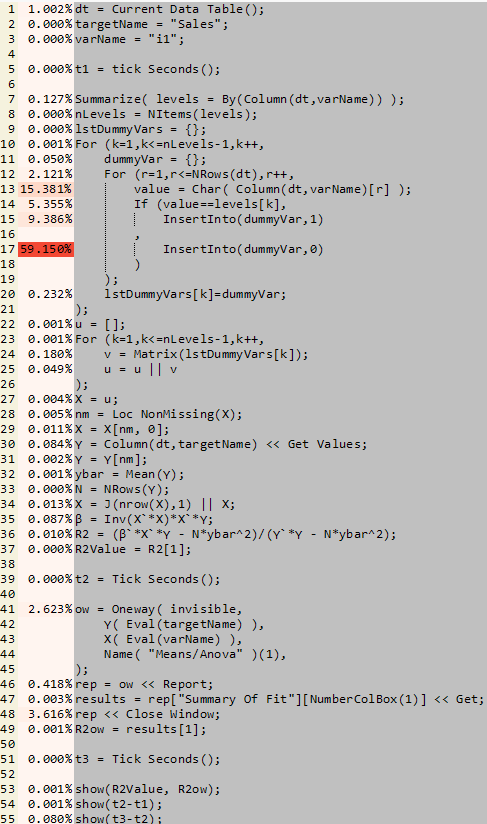
It is clear that my matrix calculation is very efficient but my data preparation is not! Line 17 clearly stands out as the bottleneck – in fact lines 13 to 17 explain about 90% of the execution time. These are the lines associated with creating my dummy variables.
The JSL Profile tool won’t tell you how to fix your code, but it will tell you where to focus your attention, and often that’s half the battle.
I’ll go and look at more efficient ways to create the dummy variables, including a utility new to version 12 of JMP: “Make Indicator Columns“.