This is one of a series of posts highlighting new features available in version 13 of JMP.
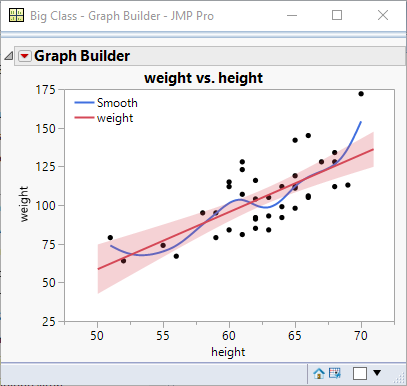
When creating a graph using Graph Builder, it is now possible to place the legend inside the graphical frame:
This is one of a series of posts highlighting new features available in version 13 of JMP.
When creating a graph using Graph Builder, it is now possible to place the legend inside the graphical frame:
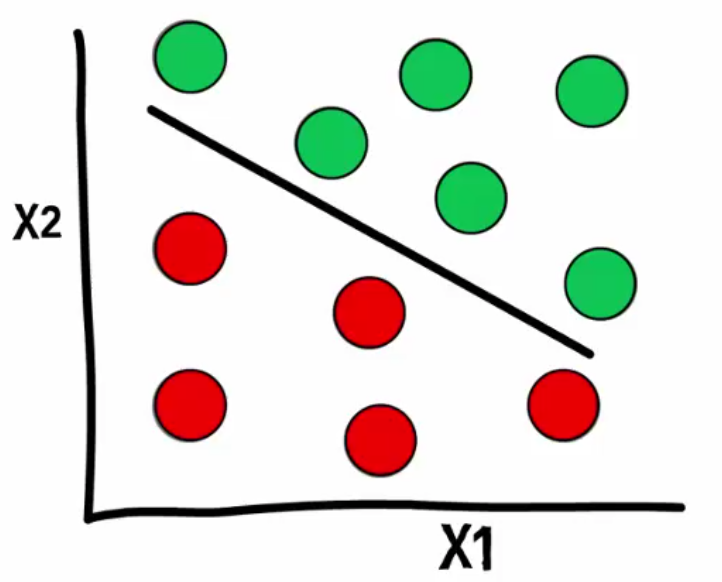 In my last post I outlined some “homework” that I had set myself – to write a script that would create linearly separable data. I want the ability to create it in an interactive environment. (more…)
I want to take a look at how shape files are organised and how you can create your own custom shapes. I’ll also take a look at an add-in that will help you digitize your shapes. But first I’ll give a short overview of the use of shape files within JMP.
Note from author: this remains one of the most popular posts on this blog – so I have written an update.
A number of platforms in JMP allow for a variable number of columns. I want to take a look at how to handle this situation using the JMP scripting language.
If you want to interactively build graphs in JMP then the graph builder platform is great.
I use it a lot when I’m not so familiar with a set of data, and I’m not quite sure how I want to plot the data. The graph builder allows me to rapidly evaluate different graphical representations.