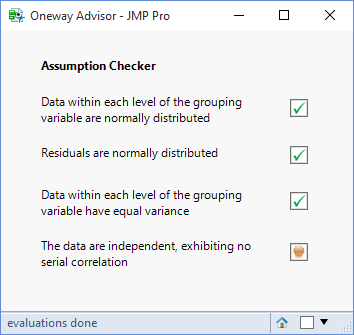
 In this final step of developing the oneway advisor I want to check the assumption of “independence”. Specifically I want to test whether there is any evidence of serial correlation on the residuals.
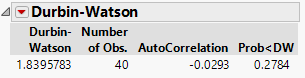
The Durbin-Watson Test
Detecting the presence of serial correlation in the residuals can be performed using the Durbin-Watson test that is found under row diagnostics within the Fit Model platform. Here are the steps:
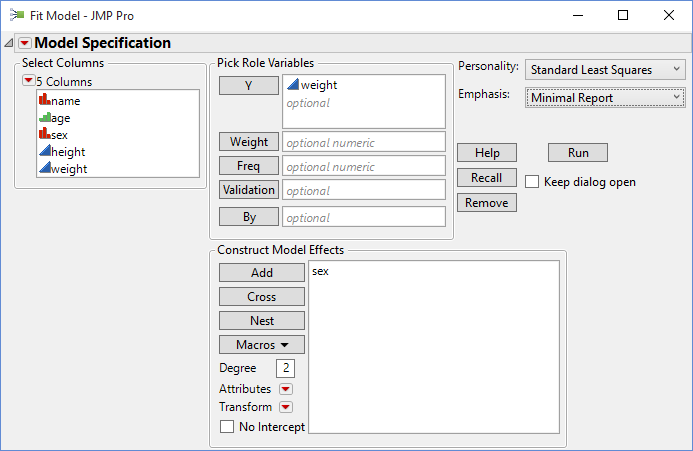
Specify the model appropriate to the oneway analysis of variance:
Select Durbin-Watson from the Row Diagnostics options:
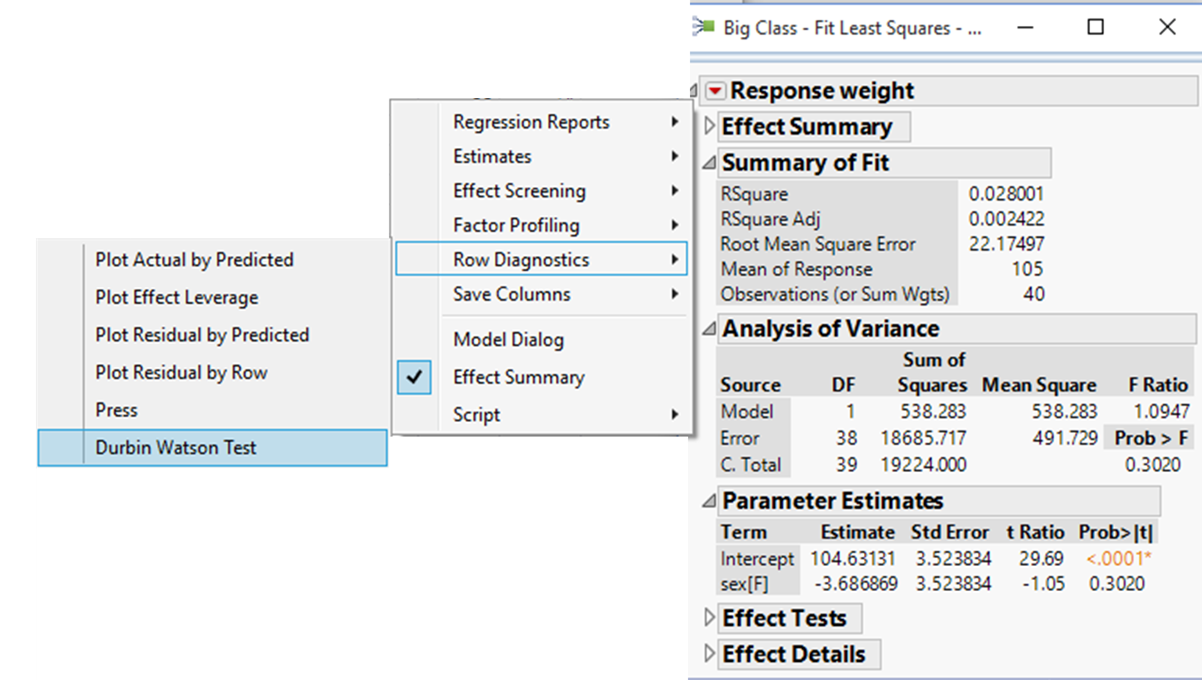
This adds an additional outline to the Fit Model window:
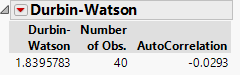
From the red triangle turn on the option to show the p-value:
So now we just want to do the same thing in JSL in a function that I will call Test Independent Observations.
Test Independent Observations
This function should be added to the JSL file Analysis Components. (This file was first introduced in step 4).
|
1 2 3 4 5 6 7 8 9 10 11 12 13 14 15 16 17 18 19 |
Test Independent Observations = Function({dt,yCol,xCol},{Default Local}, fit = dt << Fit Model( Y( Eval(yCol) ), Effects( Eval(xCol) ), Emphasis( Minimal Report ), Run ); fit << Durbin Watson Test( 1, Significance P Value ); rep = fit << Report; ob = rep["Durbin-Watson"]; cb = ob[NumberColBox("Prob<DW")]; stat = cb << Get; pValue = stat[1]; rep << Close Window; Return(pValue); ); |
Invoking the Function
Open file step6.jsl. The block of code that checks the assumptions can now be extended:
|
72 73 74 75 76 77 78 79 80 81 82 83 84 85 86 87 88 89 90 91 92 93 94 95 96 97 98 99 100 101 102 103 104 105 106 107 108 109 110 111 112 113 114 115 116 117 |
// Check assumptions alpha = 0.05; dt = Data Table(dtName); arrPValues = Test Normal Each Level(dt,yColName,xColName); minPValue = Min( arrPValues<<Get Values ); If (minPValue<=alpha, btnNormalLevels << Set Icon(nsICONS:FAIL_ICON) , btnNormalLevels << Set Icon(nsICONS:PASS_ICON) ); strTip = "p-value=" || Char(Round(minPValue,4)) || ".\!N" || "This is the smallest p-value for all the tests \!N" || "(one for each level of the grouping variable). \!N" || "For a test of normality, small p-values imply \!N" || "that the data are not normally distributed."; btnNormalLevels << Set Tip(strTip); pValue = Test Normal Oneway Residuals(dt,yColName,xColName); If (pValue<=alpha, btnNormalResids << Set Icon(nsICONS:FAIL_ICON) , btnNormalResids << Set Icon(nsICONS:PASS_ICON) ); strTip = "p-value=" || Char(Round(pValue,4)) || ".\!N" || "For a normality test, small p-values imply that\!N" || "the data are not normally distributed."; btnNormalResids << Set Tip(strTip); pValue = Test Equal Variances(dt,yColName,xColName); If (pValue<=alpha, btnEqualVariance << Set Icon(nsICONS:FAIL_ICON) , btnEqualVariance << Set Icon(nsICONS:PASS_ICON) ); strTip = "p-value=" || Char(Round(pValue,4)) || ".\!N" || "For a test of variance, small p-values imply that\!N" || "the variances are not equal across the levels."; btnEqualVariance << Set Tip(strTip); pValue = Test Independent Observations(dt,yColName,xColName); If (pValue<=alpha, btnIndependentData << Set Icon(nsICONS:FAIL_ICON) , btnIndependentData << Set Icon(nsICONS:PASS_ICON) ); strTip = "p-value = " || Char(Round(pValue,4)) || "\!N\!N" || "Small values indicate that the data are serially correlated."; btnIndependentData << Set Tip(strTip); |
Save the revisions as step7.jsl (no, no, we’ve finished!) “oneway advisor.jsl“.
Final Output
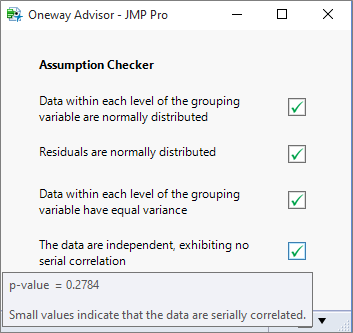
The code is now complete, but you may want to think about packaging it as an add-in.
Thanks very handy. Will certainly share site with my pals.