This is the sixth and penultimate step in constructing the oneway advisor. The advisor automates four tests associated with the assumptions of a oneway analysis of variance. In this step a test will be performed to assess whether the data within each level of the grouping variable have equal variance.
Testing For Equal Variance
This test is performed in JMP by selecting the Unequal Variance option from the red triangle option within the Oneway platform. Here is some sample output:
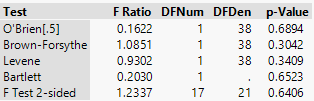
It seems that our professors of statistics can’t quite agree on how to perform this test! I can think of three ways of dealing with this table of information:
- Decide on a standard test .e.g Levene and only look at the p-value associated with this test
- Apply contextual knowledge – e.g. use the Bartlett test if the data have been demonstrated to be normally distributed, otherwise use the Levene test
- Take the worse-case outcome i.e. look at all the tests and select the lowest p-value
I’m going to choose to implement the third option.
A couple of points that will become relevant to the code implementation:
- The above table is contained within an outline box called “Tests that the Variances are Equal”
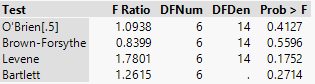
- If the grouping variable has more than two levels then the p-Value column takes the label “Prob > F” as illustrated below:
Checking the Number of Levels
Given that the output differs based on the number of levels within the grouping variable we’ll need some code to find the number of levels . There are a lot of interesting ways to implement this in code and we could go on quite a tangent exploring all the methods – but to keep the discussion focussed I’m just going to state the following code without too much justification, other than it works:
|
1 2 |
Summarize(levels = By( Column(dt,xCol)) ); numLevels = NITems(levels); |
Where dt is a reference to a data table and xCol is the string name of a column. You can verify the code by opening the “Big Class” data table and running this code:
|
1 2 3 4 5 |
dt = current data table(); xCol = "sex"; Summarize(levels = By( Column(dt,xCol)) ); nLevels = NITems(levels); show(levels,nLevels); |
Here is the JMP log window output:
![]()
Test Equal Variances
Here is the code for the implementation of the user-defined function Test Equal Variances. The code needs to be added to the file Analysis Components.jsl.
|
1 2 3 4 5 6 7 8 9 10 11 12 13 14 15 16 17 18 19 20 21 22 23 |
Test Equal Variances = Function({dt,yCol,xCol},{Default Local}, Summarize(levels = By( Column(dt,xCol)) ); nLevels = NITems(levels); ow = dt << Oneway( Invisible, Y( Eval(yCol) ), X( Eval(xCol) ), Unequal Variances( 1 ), ); rep = ow << Report; ob = rep["Tests that the Variances are Equal"]; tb = ob[TableBox(2)]; If (nLevels==2, cbPValue = tb[NumberColBox("p-Value")]; , cbPValue = tb[NumberColBox("Prob > F")]; ); lstPValues = cbPValue << Get; pValue = Min(lstPValues); rep << Close Window; Return(pValue); ); |
- Lines 3 and 4 contain the code illustrated earlier for determining the number of levels in the x-variable
- Lines 5 to 9 create a Oneway object
- Line 8 is the code equivalent of selecting Unequal Variance option found under the red triangle
- Line 10 creates the variable rep which is a reference to the window containing the Oneway results
- Line 11 gets a reference to the outline box containing the tabulated results
- Line 12 gets a reference to the table containing the results
- Line 14 creates a variable cbPValue that references the p-value column in the results table, if the number of levels is 2
- Line 16 creates a variable cbPValue that references the “Prob > F” column if the number of levels is not 2
- Line 18 gets a list of p-values from the column referenced by cbPValue
- The variable lstPValues created in line 18 is a list. The Min function identifies the smallest item in this list which is stored in the variable pValue
Implementing the Function
Now that the test is implemented in code and saved within the Analysis Components JSL file, it is available for use within the main code (step5.jsl) of the oneway advisor. To use the function the same pattern of code is used as for the tests described in the last two posts. The revisions are highlighted below:
|
72 73 74 75 76 77 78 79 80 81 82 83 84 85 86 87 88 89 90 91 92 93 94 95 96 97 98 99 100 101 102 103 104 105 106 107 108 |
// Check assumptions alpha = 0.05; dt = Data Table(dtName); arrPValues = Test Normal Each Level(dt,yColName,xColName); minPValue = Min( arrPValues<<Get Values ); If (minPValue<=alpha, btnNormalLevels << Set Icon(nsICONS:FAIL_ICON) , btnNormalLevels << Set Icon(nsICONS:PASS_ICON) ); strTip = "p-value=" || Char(Round(minPValue,4)) || ".\!N" || "This is the smallest p-value for all the tests \!N" || "(one for each level of the grouping variable). \!N" || "For a test of normality, small p-values imply \!N" || "that the data are not normally distributed."; btnNormalLevels << Set Tip(strTip); pValue = Test Normal Oneway Residuals(dt,yColName,xColName); If (pValue<=alpha, btnNormalResids << Set Icon(nsICONS:FAIL_ICON) , btnNormalResids << Set Icon(nsICONS:PASS_ICON) ); strTip = "p-value=" || Char(Round(pValue,4)) || ".\!N" || "For a normality test, small p-values imply that\!N" || "the data are not normally distributed."; btnNormalResids << Set Tip(strTip); pValue = Test Equal Variances(dt,yColName,xColName); If (pValue<=alpha, btnEqualVariance << Set Icon(nsICONS:FAIL_ICON) , btnEqualVariance << Set Icon(nsICONS:PASS_ICON) ); strTip = "p-value=" || Char(Round(pValue,4)) || ".\!N" || "For a test of variance, small p-values imply that\!N" || "the variances are not equal across the levels."; btnEqualVariance << Set Tip(strTip); |
One the revisions have been made the file should be saved as step6.jsl.
The Output
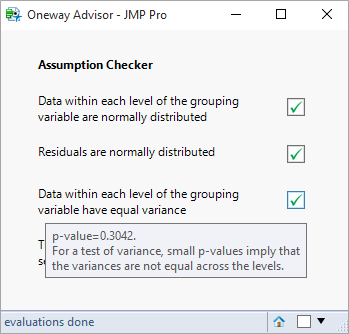
The oneway advisor is almost complete. Here is what the output should look like:
One thought on “Testing For Equal Variance”