Plotting functions is easy in JMP, at least if you are prepared to embrace a little JSL.
The function is plotted using Y Function:
|
1 |
Y Function( yExpr, xName ) |
Y Function is used within a Graph Box. Here is an example:
|
1 2 3 4 5 |
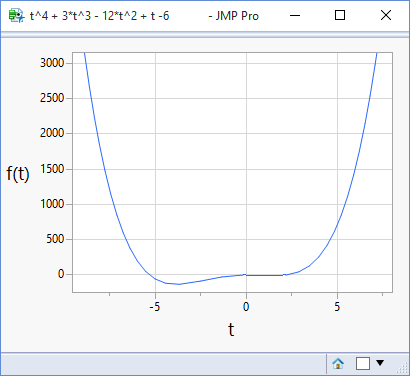
New Window( "Example", Graph Box( Y Function( t^4 + 3*t^3 -12*t^2 + t -6, t, ); ) ); |
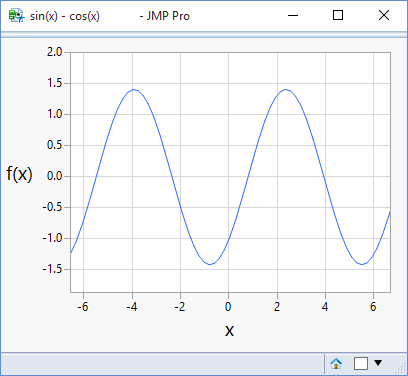
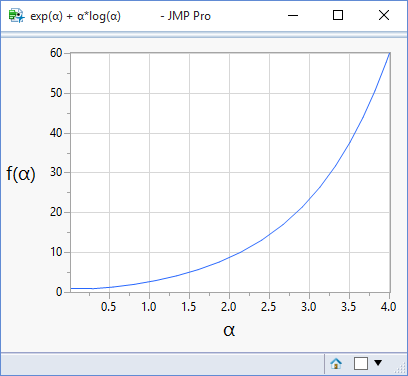
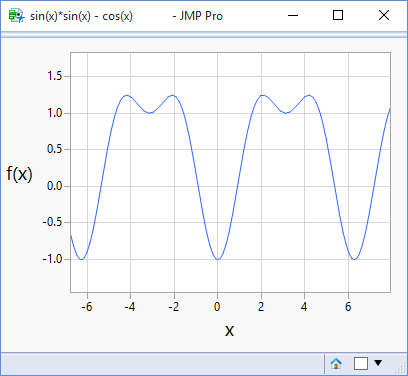
Here are some examples of output:
I use the following code to make it easier for me to enter function definitions, and to easily recall previous functions that I’ve plotted:
|
1 2 3 4 5 6 7 8 9 10 11 12 13 14 15 16 17 18 19 20 21 22 23 24 25 26 27 28 29 30 31 32 33 34 35 36 37 38 39 40 41 42 43 44 45 46 47 48 49 50 51 52 53 54 55 56 57 58 59 60 61 62 63 64 65 66 67 68 69 70 71 72 73 74 75 76 77 78 79 80 81 82 83 84 85 86 87 88 89 90 91 92 93 94 95 96 97 98 99 100 101 102 103 104 105 106 107 108 109 110 111 112 113 114 115 116 117 118 119 120 121 122 123 124 125 126 127 128 129 130 131 132 133 134 135 136 137 138 139 140 141 142 143 144 145 146 147 148 149 150 151 152 153 154 155 156 157 158 159 160 161 162 163 164 165 166 167 168 169 170 171 172 173 174 175 176 177 178 179 180 181 182 183 184 185 186 187 188 189 190 191 192 193 194 195 |
Names Default To Here(1); // references to cached function specs here:cacheActive = 0; here:cacheIndex = .; here:cachedFunction = ""; here:cachedParameter = ""; here:cachedXAxisLow = .; here:cachedXAxisHigh = .; here:cachedYAxisLow = .; here:cachedYAxisHigh = .; New Window("Function Plotter", Show Menu(0), Show Toolbars(0), Border Box(Top(10),Bottom(20),Left(20),Right(20), V List Box( here:teb = Text Edit Box("",<<Set Font Size(12),<<SetWidth(500),<<SetNLines(4),<<FixedSize(1)), Spacer Box(Size(0,10)), H List Box( Button Box("<<",DoRecallPrevious()), Button Box(">>",DoRecallNext()), Spacer Box(Size(310,0)), Button Box("Plot",DoPlotFunction()) ) ) ) ); Do Plot Function = Function({},{Default Local}, f = here:teb << Get Text; If (here:cacheActive, x = here:cachedParameter , x = Find Parameter Name(f) ); Eval(Parse(Eval Insert("\[ nw = New Window("^f^ ", Graph Box( Pen Color( "Blue" ); Y Function(^f^,^x^); ) ); ]\"))); nw[TextEditBox(2)] << Set Text(x); nw[TextEditBox(2)] << Set Font Size(14); nw[TextEditBox(1)] << Set Text("f(" || x ||")"); nw[TextEditBox(1)] << Set Font Size(14); nw[TextEditBox(1)] << Rotate Text("Horizontal"); nw[AxisBox(2)] << Show Major Grid(1); nw[AxisBox(1)] << Show Major Grid(1); If (here:cacheActive, nw[AxisBox(2)] << Min(here:cachedXAxisLow); nw[AxisBox(2)] << Max(here:cachedXAxisHigh); nw[AxisBox(1)] << Min(here:cachedYAxisLow); nw[AxisBox(1)] << Max(here:cachedYAxisHigh); ); nw << On Close( Cache Function() ); ); Find Parameter Name = Function({f},{Default Local}, pat = "(" + PatArb()>>p + ")"; isMatch = Pat Match(f,pat); If (isMatch, If (Trim(p)=="", isMatch = 0 , parameter = p ) ); If (!isMatch, pat = Pat Not Any("+-*/^")>>p; isMatch = Pat Match(f,pat); If (isMatch, parameter = p , parameter = "x" ); ); Return(parameter); ); Cache Function = Function({},{Default Local}, nw = Current Report(); path = "$TEMP/JMP-Function-Plotter.jmp"; If (FileExists(path), dt = Open(path) , dt = New Table("Functions", New Column("Function", Character), New Column("Parameter", Character), New Column("X Axis Low", Numeric), New Column("X Axis High", Numeric), New Column("Y Axis Low", Numeric), New Column("Y Axis High", Numeric) ) ); f = Trim( nw << Get Window Title ); rows = dt << Get Rows Where(:Function==f); If (NRows(rows)==0, dt << Add Row(1); r = NRows(dt) , r = rows[1] ); Column(dt,"Function")[r] = f; Column(dt,"Parameter")[r] = nw[AxisBox(2)] << Get Text; Column(dt,"X Axis Low")[r] = nw[AxisBox(2)] << Get Min; Column(dt,"X Axis High")[r] = nw[AxisBox(2)] << Get Max; Column(dt,"Y Axis Low")[r] = nw[AxisBox(1)] << Get Min; Column(dt,"Y Axis High")[r] = nw[AxisBox(1)] << Get Max; Close(dt,Save(path)); ); Do Recall Previous = Function({},{Default Local}, here:cacheActive = 0; path = "$TEMP/JMP-Function-Plotter.jmp"; If (!FileExists(path), Beep(); Throw() ); dt = Open(path); nr = NRows(dt); Close(dt,NoSave); If (IsMissing(here:cacheIndex), here:cacheIndex = nr , here:cacheIndex--; ); If (here:cacheIndex <=0, here:cacheIndex = 0; Beep(); Throw() ); Do Recall(); ); Do Recall Next = Function({},{Default Local}, here:cacheActive = 0; path = "$TEMP/JMP-Function-Plotter.jmp"; If (!FileExists(path), Beep(); Throw() ); dt = Open(path); nr = NRows(dt); Close(dt,NoSave); If (IsMissing(here:cacheIndex), here:cacheIndex = nr , here:cacheIndex++; ); If (here:cacheIndex > nr, here:cacheIndex = nr; Beep(); Throw() ); If (here:cacheIndex <=0, here:cacheIndex = 0; Throw() ); Do Recall(); ); Do Recall = Function({},{Default Local}, dt = Open(path); r = here:cacheIndex; here:cachedFunction = Column(dt,"Function")[r]; here:cachedParameter = Column(dt,"Parameter")[r]; here:cachedXAxisLow = Column(dt,"X Axis Low")[r]; here:cachedXAxisHigh = Column(dt,"X Axis High")[r]; here:cachedYAxisLow = Column(dt,"Y Axis Low")[r]; here:cachedYAxisHigh = Column(dt,"Y Axis High")[r]; Close(dt,NoSave); here:teb << Set Text( here:cachedFunction ); here:cacheActive = 1; ); |
Greetings, I am exploring your site and appreciate that you are willing to share the scripts and insights.
In some cases, the border bar above the script responds to a click by permitting a copy and paste. The one on this page [Plotting Functions] does not. Is it possible to either activate this feature or obtain the code via email?
Regards,
Tim Hockswender
Hi Tim. I’ve updated the widget so that it displays the top border bar.