JMP is brilliant for real-time data capture. Add to that the ability to use JSL to construct “industrial” style user-interfaces and its easy to get JMP deployed in an environment that relies on simple to use robust data capture from online measurement systems.
Industrial Interface
An industrial interface is not a prerequisite to implementing real-time data capture but I think it really helps. So what do I mean by the term industrial interface? In a research lab or shop-floor industrial setting you are not typically sitting at a PC doing computer stuff. The PC is there to display information and to initiate workflow related events. You need to be able to interact with the software as you go about your work – often standing, maybe wearing gloves, often preferring the keyboard to a mouse. To see the screen clearly it should be minimalist, with big bold text and chunky buttons. The space key should act as a mouse click and automatically know what part of the screen needs to be clicked.
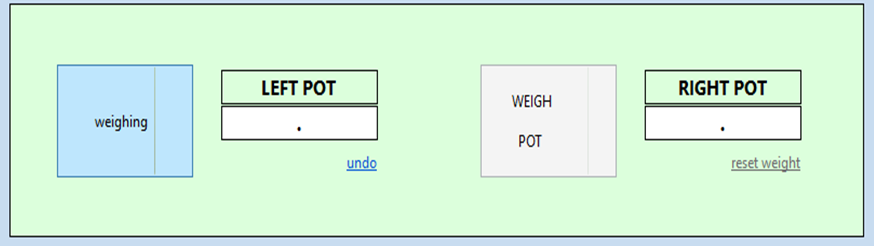
Here is an example:

The top-most panel displays context information. Beneath that there are two fat buttons “weigh pot” with clear labelling that they refer to “left” and “right” pots. Using these buttons the user can directly initiate a specific measurement (left or right).
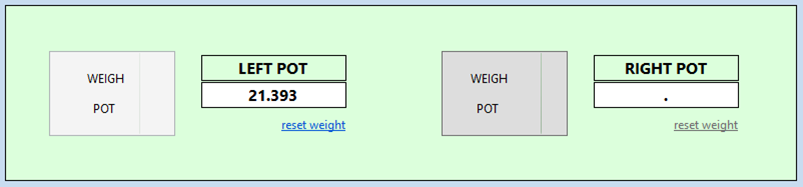
Once the measurement is initiated the user-interface gives immediate feedback that a measurement is in progress:
And the final data measurement is then displayed:
The lower portion of the screen shows a big fat button in the shape of a spacebar:
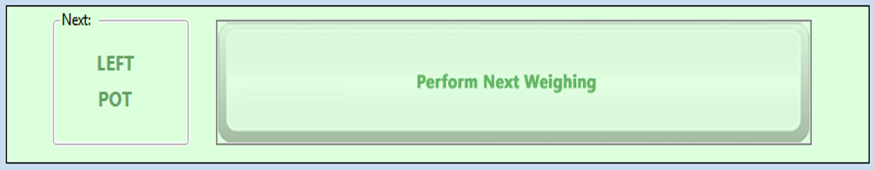
This performs the “next action”. Instead of the user clicking the left weigh pot button followed bu the right weigh pot button they can simply use this spacebar button. Its function automatically steps through the preferred sequence of measurements. But the user doesn’t need to fumble with a mouse – the action can also be initiated using the physical key on the keyboard.
Data Capture
The essence of data capture is very simple, and is performed using the code structure shown below:
|
1 2 3 4 5 6 7 8 9 10 11 12 13 14 15 16 17 |
FeedHandler = Function({},{Default Local}, nsBalance = Namespace("balance.pega-analytics.co.uk"); reading = nsBalance:feed << Get Line; InsertInto(nsBalance:readings, reading); ); feed = Open Datafeed( Connect( Port( "com1:" ), Baud( 1200 ), DataBits( 7 ), Parity( None ) ), Set Script( FeedHandler() ) ); |
The Open Datafeed function is used to create a datafeed object that does the hard work of handling the serial communication with the online measurement device. In the above example serial communication uses 7-bits with a data transmission speed (baud rate) of 1200 bits per second on port com1. Parity bits are not used for error checking. The settings that need to be used will be determined by the configuration of the measurement device. For illustration here is an excerpt of documentation for an online balance:
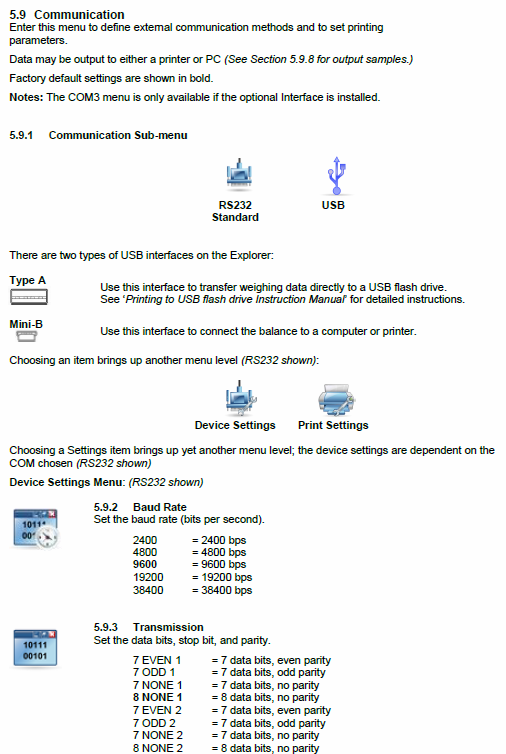
Based on this documentation the default is 8-bits at 9600 bits per second with no parity checking. Which port? That depends on the physical connection to the PC. Increasing serial ports are being replaced by USB connections which then require device driver software to mimic the behaviour of the serial port. Figuring out the simulated port number is sometimes the hardest problem to solve!
So returning to my code. Apart from establishing the communication protocol, it also assigns an event handler that is responsible for managing data received across the serial link. My handler is called Feed Handler and I use it simply to push the data into a list for post-processing at a later stage.
It’s important to understand that the data feed and associated handler are operating in the background as a parallel thread of activity. I initiate this activity when I create the window on the screen – not when a measurement click event occurs. The measurement click event simply triggers another task, to unravel the contents of the list that is being populated by the feed handler. What processing occurs depends on the nature of the online measurement and the structure in which it is presented. If I am performing an online measurement then ideally I would simply clear the data feed list and then wait for a new measurement to arrive. An online balance may only send a measurement when it has stabilised and found a single measurable value, or it might send a stream of values which I then need to filter to determine when the measurements have become stable. The measurement values may consist only of numbers or they may have units attached which need to be stripped off before the numbers can be processed.
Before deciding how to process the information, it is useful to simply dump all of the output into a data table so that you can see what is going on. This is also a simple way to see if your communication options are set correctly. I use the following script to capture 30 seconds of output into a table:
|
1 2 3 4 5 6 7 8 9 10 11 12 13 14 15 16 17 18 19 20 21 22 23 |
Feed Handler = Function({},{Default Local}, reading = ::feed << Get Line; InsertInto(::readings, reading); ); ::readings = {}; ::feed = Open Datafeed( Connect( Port( "com1:" ), Baud( 1200 ), DataBits( 7 ) ), Set Script( FeedHandler() ) ); Wait(30); ::feed << Stop; ::Feed << Close; New Table("Feed", New Column("Data", character,Set Values(::readings)) ); |
Nice explanation of shop floor requirements for a GUI.
I used a modification of this code today. I intend to write a program such that this data is uploaded to our LIMS server, and later retrieved and entered into our instrument software.
Thanks a bunch for your help!
Thanks. That is great to hear!
Er, and by help, I meant providing the tutorial on this page! Not assistance setting up the complex program I described.
Just in case the other was inferred!