It turns out that the prediction profiler has a hidden secret. And not just some easter egg feature that is just a bit of fun. This secret is core to how you use the profiler – and might just totally change how you use it in future.
Category Archives: Visualisation
Segmented Regression
I’m sure there is a more technically correct term for this: I use the phrase segmented regression to describe the process whereby I select a segment of data within a curve and build a regression model for just that segment.
I have some code to aid the process. The code illustrates how to perform regression on-the-fly as well as how to utilise the MouseTrap function to handle mouse movement events.
Fives and Sixes
In my last post I was able to successfully re-orient a set of pixel data to reconstruct images of handwritten digits. SInce version 12 of JMP we have been able to create expression table columns that can contain images. That’s a logical location to store my newly revealed images:
Flippin’ Images
My last post contained a picture of a window that contained a grid of images. This was a randomly generated array of images based on an extract from the MNIST dataset. This database contains over 60,000 samples of handwritten digits.
However, my pixel data was disoriented and the images looked more like hieroglyphs. Fortunately JMP understands an image as an ‘object’, and allows a variety of transformations to be applied to it, including flipping and rotating.
Hieroglyphics?
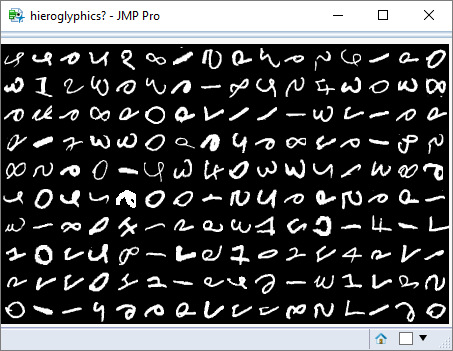
What is this? Any guesses?
(to be continued… )
A Matter Of Perspective
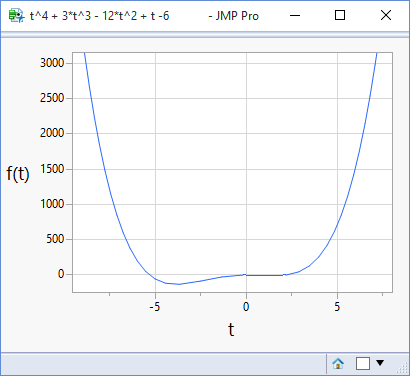
In my last post I illustrated how JMP can be used to plot mathematical functions. Visualising a function brings it to life, but what we see and how we interpret it can be very sensitive to the scale that we use. The following plots are of the same function but using different ranges for the x-axis:

Plotting Functions
Go Get Your Tape Measure
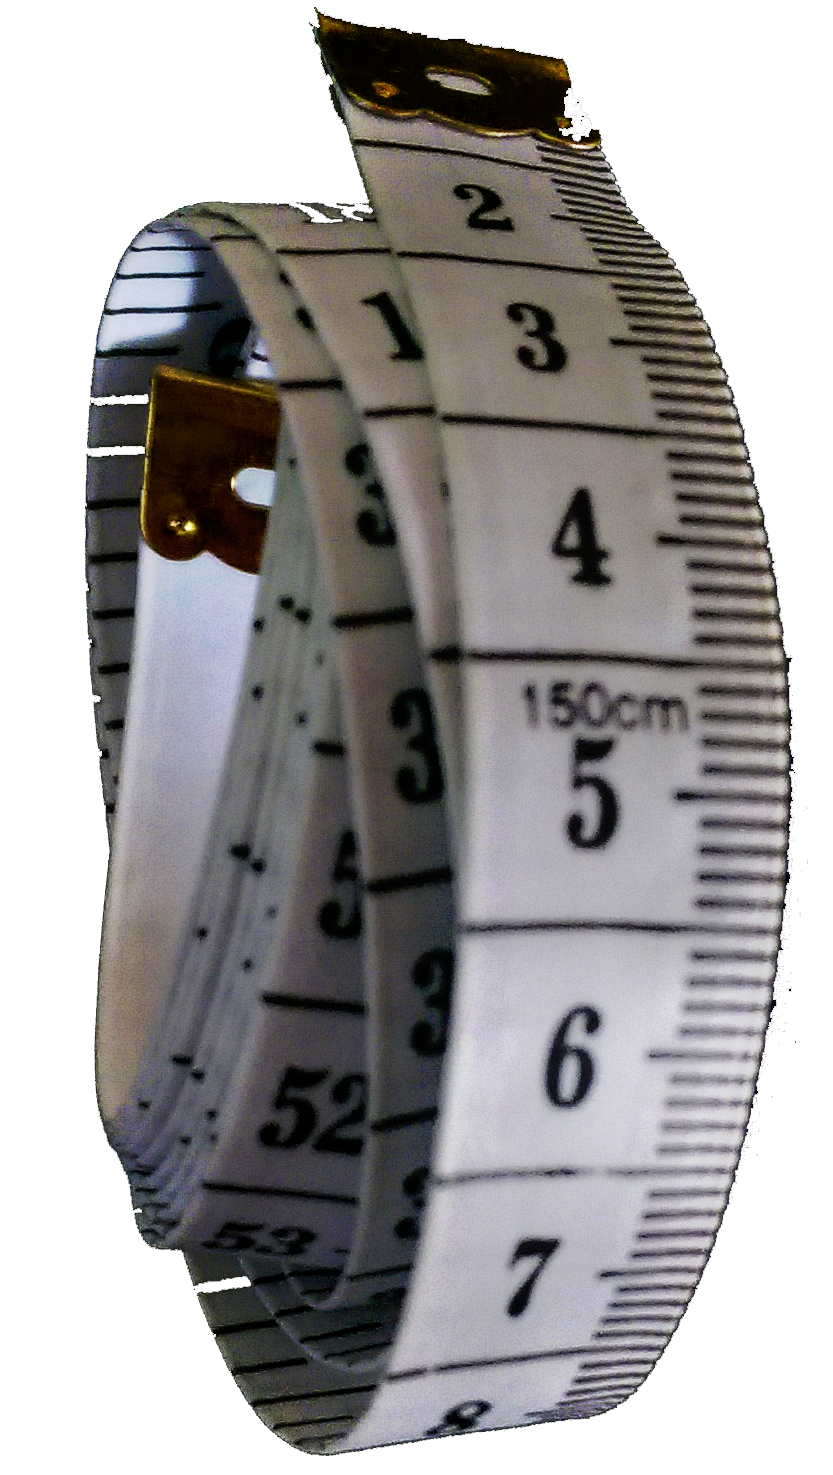
JMP Software comes complete with a large number of sample data tables.
The other day I found one containing body measurement data: (more…)
Visualising Machine Learning Pt. 2
Where is the “learning” in machine learning? The problem with machine learning algorithms is that they yield a final solution without giving you a sense of the learning process. So I’ve implemented an interactive version of a perceptron learning algorithm. To run the algorithm I need lenearly separable data – hence the posts from the previous weeks. Now I can use that as the basis for visualising the machine learning steps. (more…)
Visualising Machine Learning pt.1
My last two posts have been talking creating linearly separable data. Hopefully you found some of the features interesting – for example, the idea of creating interactivity using grab handles. But I never really gave a purpose to what I was doing: I wanted to write some machine learning code – specifically a perceptron learning algorithm – and to test the code I needed to create some data on which it could act. (more…)