In this post I will continue with my so-called hieroglyphics project. This project uses a set of image data that describes handwritten characters. The dataset is frequently used to evaluate machine-learning algorithms. I’m using the dataset to explore a variety of modelling techniques within JMP.
In my last post I used a script to incrementally add terms to my model so that I could explore the performance of the model with increasing complexity. But the order in which I added the terms was based on a heuristic and it wasn’t necessarily optimal. So in this post I want to explore using stepwise regression.
Continuing the Journey
In my last post I discovered that I would probably benefit from using more data, so I have bumped the size of data table up to 5,000 rows with a 60/20/20 split between training, validation and test. This will increase processing time particularly given that I have up to 784 terms to accommodate. Each term corresponds to an image pixel. But I know that some pixels remain turned off across all images so I’ve written a script to remove them. In fact it is a useful script for pre-processing any data prior to modelling, since it removes any columns that contain only a single value across all the rows:
|
1 2 3 4 5 6 7 8 9 10 11 12 13 14 15 16 17 |
Remove Singular Columns = Function({dt},{Default Local}, lstCols = {}; For (i=1,i<=NCols(dt),i++, Summarize(levels=By(Column(dt,i))); If (NItems(levels)<=1, InsertInto(lstCols,Column(dt,i)) ) ); If (NItems(lstCols)>0, dt << Delete Columns(lstCols); ) ); dt = Current Data Table(); Remove Singular Columns(dt); |
This reduces the number of pixel-columns from 784 to “only” 622!
Running Stepwise
So now I can use these 622 columns as model terms in the Fit Model platform configured to use a stepwise personality. Once configured all I need to do is click the Go button. But not so fast! Stepwise is a computationally intensive procedure; I have no idea how long it will take and once it starts it wont want to stop.
Stepping Carefully
I prefer to use a code wrapper to give more additional control of the stepwise procedure. I want it to do a number of things:
- Give me an indication of progress with an estimated completion time
- Create some “space” during the execution that will allow be to request a “cancel”
- Place a time-limit or a size-limit on the modelling
This is what the code looks like:
|
1 2 3 4 5 6 7 8 9 10 11 12 13 14 15 16 17 18 19 20 21 22 23 24 25 26 27 28 29 30 31 32 33 34 35 36 37 38 39 40 |
dt = Current Data Table(); cols = dt << Get Column Group("Pixel Data"); fm = Fit Model( Validation( :validation ), Y( :digit ), Effects( Eval(cols) ), Personality( "Stepwise" ), Run ); model = fm << Get Scriptable Object; nw = New Window("Progress:", Border Box(Top(20),Bottom(20),Left(20),Right(20), V List Box( tbinfo = Text Box(), tbEst = Text Box(), Button Box("ABORT",::doAbort=1) ) ) ); ::doAbort = 0; t1 = Tick Seconds(); nSteps = 100; For (i=1,i<=nSteps,i++, If (::doAbort, Break() ); tbinfo << Set Text("Step " || Char(i)); tbInfo << Reshow; Wait(0); model << Step; t2 = Tick Seconds(); duration = t2 - t1; total = duration*nSteps/i; estimate = Format(Today()+total-duration,"h:m"); tbEst << Set Text("estimated completion = " || estimate); tbEst << Reshow; nw << Bring Window To Front; Wait(0); ); nw << Close Window; |
The script is set up to add up to 100 terms to the model (rather than just click Go). I ran the code overnight but it still hadn’t completed – I aborted the execution and captured the results for 63 steps (the code uses a global variable ::doAbort that allows me to quit the stepwise regression prematurely whilst retaining all of the results that have been collected).
The Results
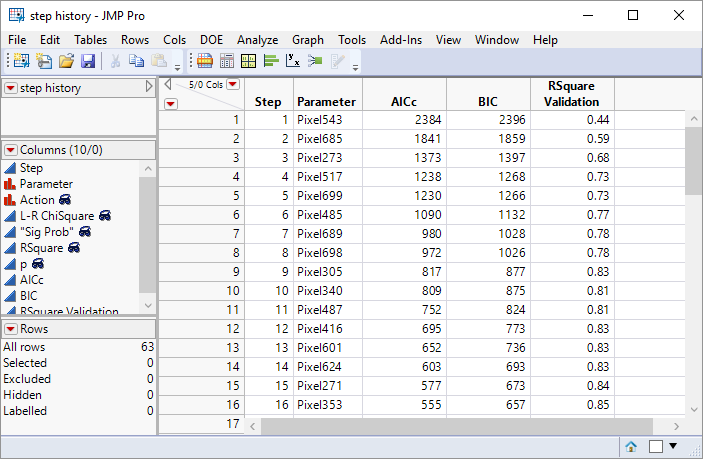
One of the great things about JMP is that whenever an output report contains tabulated results, you right-click and save them as a data table. Here is part of my step history:
The plot below shows how the AICc and BIC statistics evolve with the number of steps:
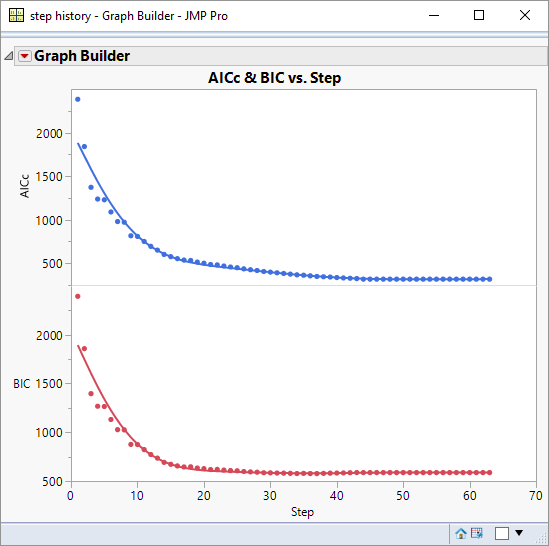
Qualitatively the graphs give an indication of when the statistics plateau, and hence the point at which there is no benefit from adding additional terms. The graphs tell me that it was reasonable for me to abort my script when I did. Phew!
If I apply a rule-of-thumb that a consistent step-change in the statistic of less than 2 is not significant then I can quantify the plateau point: for AICc it is at 44 steps and for BIC it is at 29 steps.
Next I want to take a look at the performance of the Validation R-Square. Since I also have the training R-Square it will be useful to overlay the graphs:
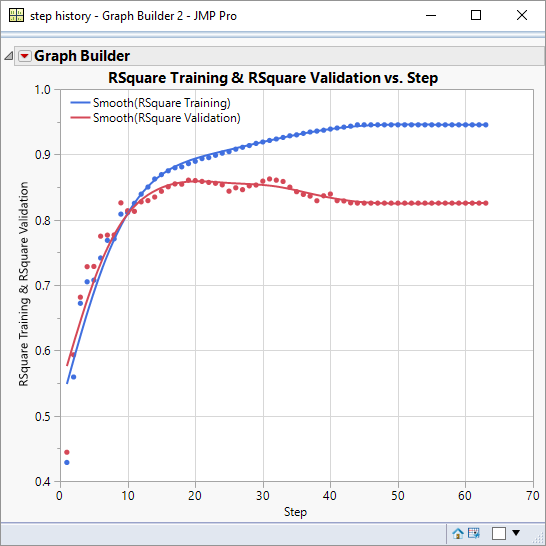
As you would expect the training R-Square just wants to increase as model complexity increases whereas the validation R-Square plateaus and then declines.
Running Stepwise
Next I would like to look at the performance graphs for misclassification rates. This information is not contained in the step history, so I need to use a script to retrieve the information.
|
1 2 3 4 5 6 7 8 9 10 11 12 13 14 15 16 17 18 19 20 21 22 23 24 25 26 27 28 29 30 31 32 33 34 35 36 37 38 39 40 41 42 43 44 45 46 47 48 49 50 51 52 |
dtParams = Data Table("step history"); lstCols = Column(dtParams,"Parameter"); dt = Data Table("Output"); lstNumTerms = {}; lstTrnRates = {}; lstValRates = {}; lstTstRates = {}; t1 = tick seconds(); cols = dt << Get Column Group("Pixel Data"); For (i=0,i<=NRows(dtParams),i++, t2 = tick seconds(); If (t2-t1>30*60, Break() ); If (i==0, lstFactors = lstCols[1] , lstFactors = lstCols[1::i] ); fm = dt << Fit Model( Y( :digit ), Effects( Eval(lstFactors) ), Validation( :Validation ), Personality( "Nominal Logistic" ), Run( Likelihood Ratio Tests( 0 ), Wald Tests( 0 ), Logistic Plot( 0 ) ), SendToReport( Dispatch( {}, "Fit Details", OutlineBox, {Close( 0 )} ) ) ); model = fm << Get Scriptable Object(); rep = model << Report; mat = rep[NumberColBox(15)] << Get As Matrix; trainingRate = mat[6]; mat = rep[NumberColBox(17)] << Get As Matrix; valRate = mat[6]; mat = rep[NumberColBox(19)] << Get As Matrix; testRate = mat[6]; InsertInto(lstTrnRates,trainingRate); InsertInto(lstValRates,valRate); InsertInto(lstTstRates,testRate); If (i==0, InsertInto(lstNumTerms,1) , InsertInto(lstNumTerms,i) ); rep << Close Window; ); New Table("Result #Terms", New Column("Num Terms", numeric, Set Values(lstNumTerms)), New Column("Misclassification Rate (training)", numeric, Set Values(lstTrnRates)), New Column("Misclassification Rate (validation)", numeric, Set Values(lstValRates)), New Column("Misclassification Rate (test)", numeric, Set Values(lstTstRates)) ) |
In about the time it takes to boil a kettle, this script gives me a data table of results. Graphing training and validation misclassification rates versus number of terms helps me assess the level of performance I can expect from the model and the number of terms that I need:
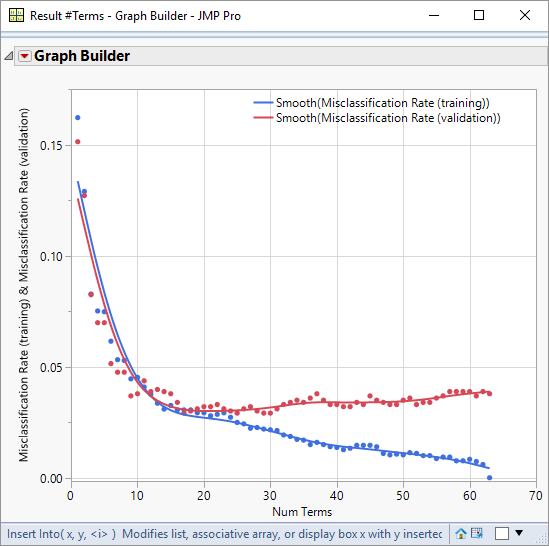
Using a model of 20 terms I can expect to achieve a misclassification rate of just 3%.
One thought on “Stepping Carefully”