The basic but essential role of a screening design is its ability to estimate main effects. In this post I will look at how well this is achieved using a DSD.
Estimability
DSDs allow estimates of main effects that are not biased by two-factor interactions. I can illustrate this using the alias matrix: here it is for a 5-factor design:
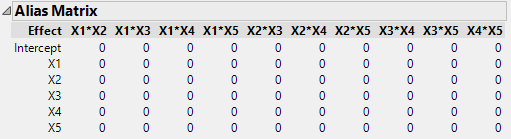
The number of runs associated with this design is 13.
If I wanted to create a classical design with 5 factors, I would have the following options:
- Resolution III fractional factorial, 8 runs:
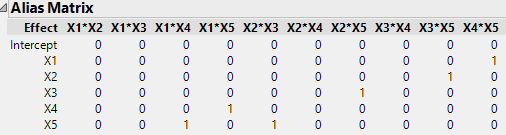 This design confounds the main effects with two-factor interactions.
- Plackett-Burman design, 12 runs
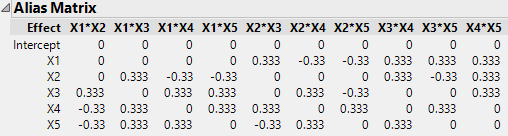 These designs are very efficient at estimating main effects, but the estimates are partially aliased with two-factor interactions.
- Resolution V design, 16 runs
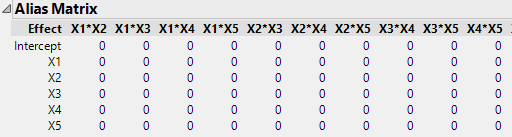 In general, the “next size up” from a Resolution III design will be either resolution IV or V depending on the number of factors. For these designs there is no confounding between main effects and two-factor interactions but are typically much larger than the DSD.
Another approach to estimating main effects is to construct a custom design. I’ll take a look at this approach but first I want to look at efficiency of estimation.
Efficiency of Estimation
With classical designs, resolution is increased by increasing the number of experiment runs. This also impacts the power of estimation of effects.
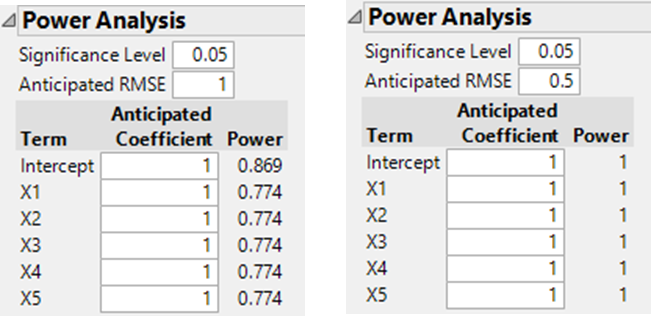
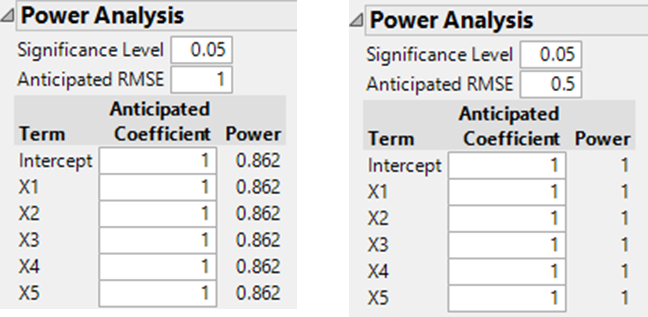
For purposes of comparison I’ll use unit coefficients and an anticipated RMSE of 1. The actual power achieved by the design will depend on the signal-to-noise ratio (influenced by choice of factor ranges and measurement capability): to make this clear I’ve also included the power for a smaller RMSE.
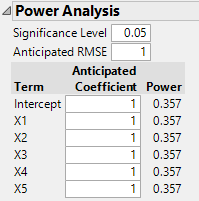
- 5 Factor Definitive Screening Design, 13 runs
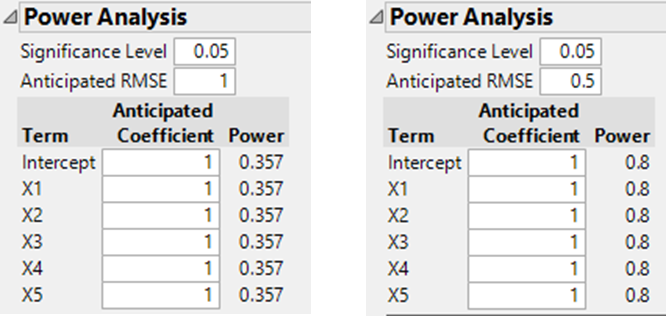
- Resolution III fractional factorial, 8 runs:
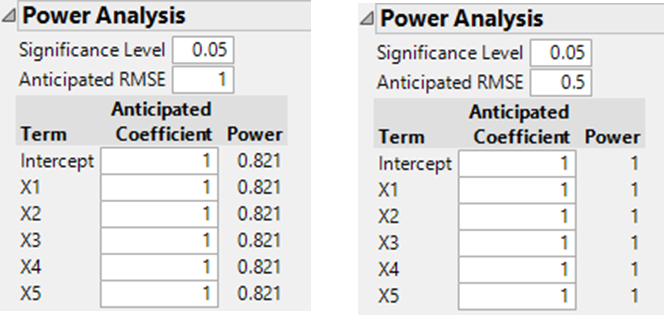
- Plackett-Burman design, 12 runs
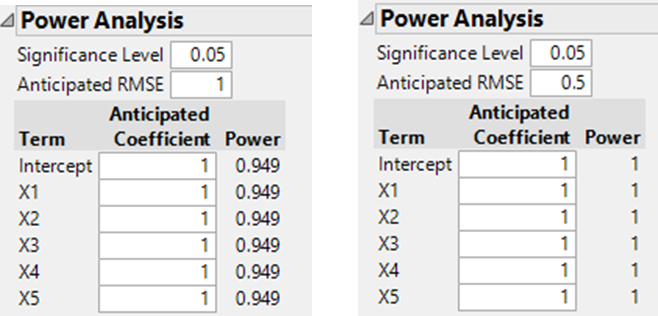
- Resolution V design, 16 runs
A design can help ensure that the data is used efficiently and that the power of estimation is uniform across the effects but ultimately you get what you pay for. The power curve below shows a theoretical expectation for the case where RMSE is 1:
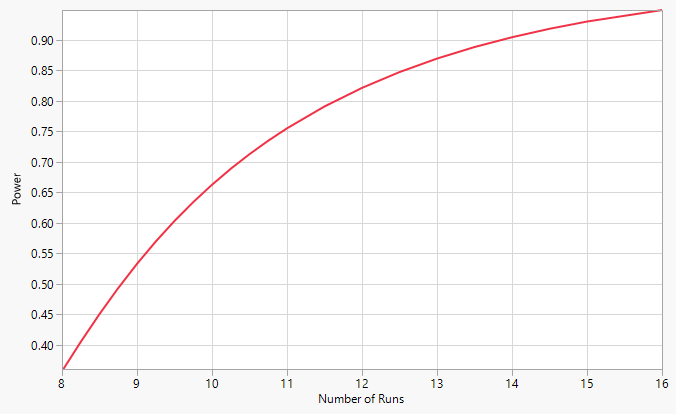
The classical designs are in agreement with this curve. The DSD is slightly less efficient: the power for the DSD is about 90% of the value of the curve for a 13 run design.
A Comparison With D-Optimal Designs
Next I want to compare characteristics of a computer generated design based on a D-optimal algorithm. I’ll build a number of designs to help me compare characteristics.
My first design is based on 5 factors with a model specification that only includes main effects. I’ll take the default number of runs (12). Here is the alias matrix:

It’s the same as the Plackett-Burman design (Plackett-Burman designs are D-optimal).
If I want to create a design with no aliasing between main effects and two-factor interactions then I can add the two-factor interactions to the model specification. This will increase the number of runs to 16 resulting in the equivalence to the Resolution V factorial design.
Custom designs give me explicit control of the number of runs. So I can create one with the same number of runs as the DSD. Here is the power analysis for an 13-run design with model specified with only main effects:
Scale
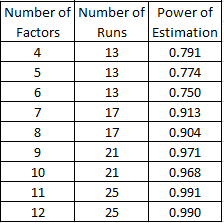
I have been looking at the performance of designs with 5 factors. This was a purely practical choice to make the size of the alias matrices manageable. But it’s worth looking at how performance changes with the number of factors.
With respect to the the aliasing matrix, DSDs always produce main effects that are not biased by two-factor interactions. The power of estimation does change with the factors; specifically it increases with larger designs:
Quadratic Effects
Classical screening designs can be augmented with centre points to help detect the presence of quadratic effects. If present, further experimentation is required to make the effects estimable.
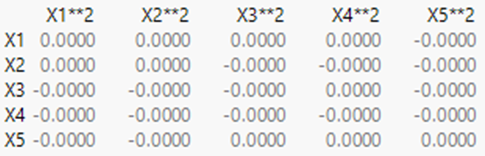
The unique feature of DSDs is their three-level structure that allows screening to be performed in the presence of these second-order effects.
I’ll be taking a closer look at estimation of quadratic effects in a separate post, but it’s worth noting at this point that the main effects are not correlated with the quadratic effects:
Hi Dave,
Really enjoy this series on DSDs. Very helpful pictures. Are you still planning to post on quadratic effects? Are there tricks to design DSDs with more factors and cutting columns out to make more quadratic effects estimable?
Hi Gwen
Thanks for your feedback. I still have plans for a number of additional posts on DSD’s, specifically to look at estimations of interactions and quadratic effects, and also a look at some techniques that work well for modelling the data generated from these types of designs. I’m not sure I understand your question about the quadratic effects; all the quadratic effects are estimable, although we sometimes have to use some tricks specific to the DSDs when it comes to modelling the terms.
parabéns pelas postagens
Qual a diferença entre confounding e aliased?
obrigado
perdão
entre confounding e aliasing?