I was recently processing a number of files using pattern matching. During the processing I was storing information in lists which were subsequently used to populate new JMP data tables.
 Everything worked fine until I increased the number of files by a factor of 10.
After some time I started hitting ‘escape’ and ‘CTRL-Z’ in a frenetic effort to seize control of my laptop.
I had hit a performance trap associated with inserting data into a list.
InsertInto( myList, value )
If you insert 1000 items into the list you would expect it to take 10 times longer than the time it would take to insert 100 items. That is, you expect performance to be linear:
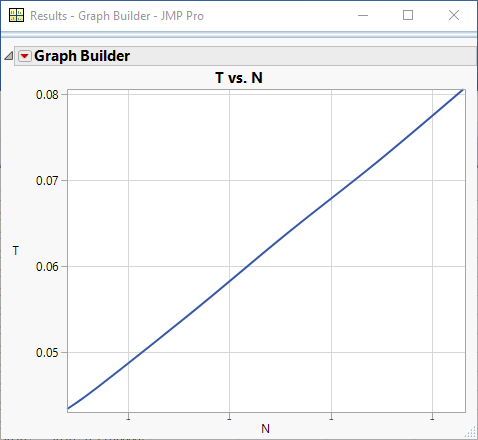
However, as the number of items gets larger the performance significantly degrades.
You can investigate this yourself by experimenting with the value for maxN in the code below:
|
1 2 3 4 5 6 7 8 9 10 11 12 13 14 15 16 17 18 19 20 21 22 23 24 25 26 27 |
lstN = {}; lstT = {}; maxN = 20000; maxT = 5*60; t1 = Tick Seconds(); For (i=1,i<=maxN,i++, InsertInto(lstN,i); t2 = Tick Seconds(); duration = t2-t1; InsertInto(lstT,duration); If ( duration>maxT, Break() ); ); dt = New Table("Results", New Column("N",numeric,continuous,Set Values(lstN)), New Column("T",numeric,continuous,Set Values(lstT)), ); dt << Graph Builder( Size( 463, 371 ), Show Control Panel( 0 ), Show Legend( 0 ), Variables( X( :N ), Y( :T ) ), Elements( Smoother( X, Y, Legend(3), Lambda(7000) ) ), SendToReport( Dispatch( {}, "N", ScaleBox, {Label Row( Show Major Grid( 1 ) )} ), Dispatch( {}, "T", ScaleBox, {Label Row( Show Major Grid( 1 ) )} ) ) ); |
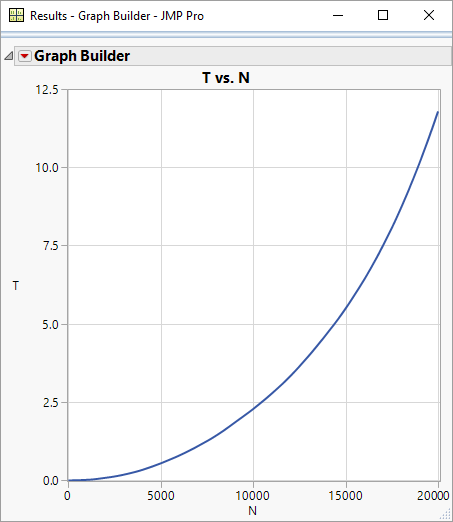
Fortunately there is a simple way out of this performance trap. The default behaviour of the Insert function is to append the item to the end of the list. It is however, possible to place the item at the front:
InsertInto( myList, value, 1 )
Unlike the default behaviour, this operation scales linearly with the number of items. Once the list is fully constructed the order of items can be reversed to produce to original ordering of the data:
ReverseInto( myList )
Here is the code restructured to use this new approach:
|
1 2 3 4 5 6 7 8 9 10 11 12 13 14 15 16 17 18 19 20 21 22 23 24 25 26 27 28 29 |
lstN = {}; lstT = {}; maxN = 20000; maxT = 5*60; t1 = Tick Seconds(); For (i=1,i<=maxN,i++, InsertInto(lstN,i,1); t2 = Tick Seconds(); duration = t2-t1; InsertInto(lstT,duration,1); If ( duration>maxT, Break() ); ); ReverseInto(lstN); ReverseInto(lstT); dt = New Table("Results", New Column("N",numeric,continuous,Set Values(lstN)), New Column("T",numeric,continuous,Set Values(lstT)), ); dt << Graph Builder( Size( 463, 371 ), Show Control Panel( 0 ), Show Legend( 0 ), Variables( X( :N ), Y( :T ) ), Elements( Smoother( X, Y, Legend( 3 ), Lambda(7000) ) ), SendToReport( Dispatch( {}, "N", ScaleBox, {Label Row( Show Major Grid( 1 ) )} ), Dispatch( {}, "T", ScaleBox, {Label Row( Show Major Grid( 1 ) )} ) ) ); |
And here is the performance (with maxN=10million!)
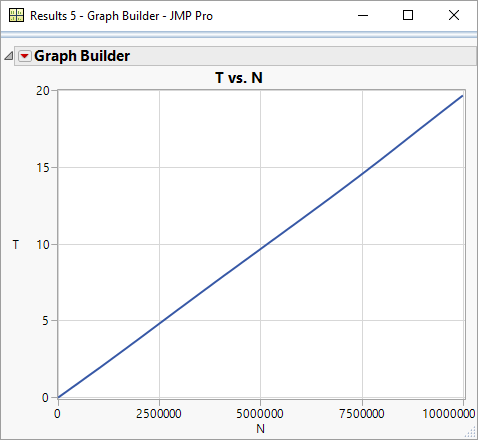
wow. looking at the numbers on the last graph you did 5 million inserts in 10 seconds whereas before you got less than 20k for the same duration. impressed!
Vielen Dank! Wollt ich nur sagen.