Quality control techniques such are control charts and Gage R&R studies sometimes feel as if they are stuck in the pre-computer age. For example they typically use range as a measure of dispersion since it is far easier to calculate than a standard deviation.
Once the range is calculated it can be converted to a standard deviation – usually by reference to a look-up table:
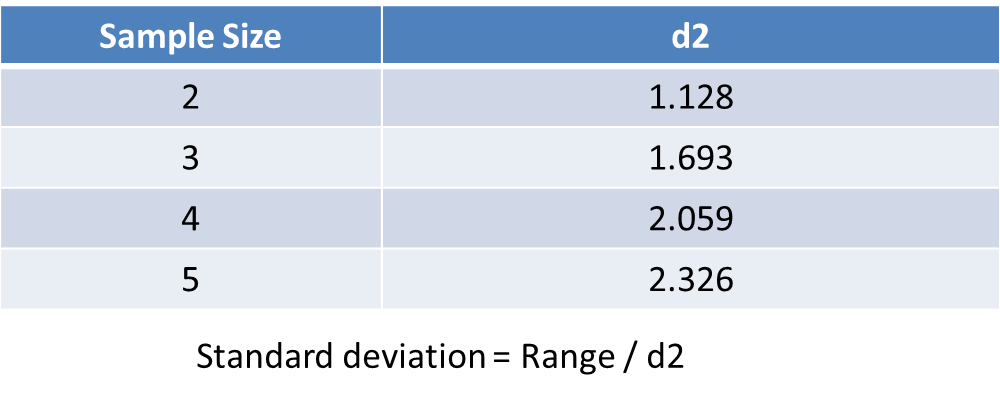
Hence when an Xbar-R chart is constructed the R chart can be used to estimate the standard deviation that is then used to compute the control limits on the Xbar chart.
When I think about this, a couple of questions come to mind. First, where do the d2 values come from, and second, in this computer age shouldn’t we just compute standard deviation and avoid the need to look-up values.
Where Does d2 Come From?
Range is a cumbersome statistic – see this Wiki entry for a description of the associated probability distributions. However, using JSL it is easy to investigate the behaviour of the range statistic.
The code below generates 1 million data values sampled from a normal distribution with mean of 0 and variance of 1. These values are then placed into 250,000 subgroups of size 4. For each subgroup summary statistics (mean, variance, standard deviation and range) are computed and displayed using the distribution platform:
|
1 2 3 4 5 6 7 8 9 10 11 12 13 14 15 16 17 18 19 20 21 22 23 24 25 26 27 28 29 30 31 |
Names Default To Here(1); lstYValues = J(1000000,1,Random Normal(0,1)); lstGrpValues = Repeat(1::250000,4); dt = New Table("Sample Data", New Column("group", numeric, ordinal, SetValues(lstGrpValues)), New Column("Y", numeric, continuous, SetValues(lstYValues)), ); dt << Sort(By(:group),Replace Table); tab = dt << Tabulate( Add Table( Column Table( Analysis Columns( :Y ), Statistics( Mean, Variance, Std Dev, Range ) ), Row Table( Grouping Columns( :group ) ) ) ); dtStats = tab << Make Into Data Table; tab << Close Window; New Window("Sample Stats", H List Box( dt << Distribution( Continuous Distribution( Column( :Y ),Quantiles(0), Outlier Box Plot( 0 ) ) ), dtStats << Distribution( Continuous Distribution( Column( :Name( "Mean(Y)" ) ),Quantiles(0), Outlier Box Plot( 0 ) ), Continuous Distribution( Column( :Name( "Variance(Y)" ) ),Quantiles(0), Outlier Box Plot( 0 ) ), Continuous Distribution( Column( :Name( "Std Dev(Y)" ) ),Quantiles(0), Outlier Box Plot( 0 ) ), Continuous Distribution( Column( :Name( "Range(Y)" ) ),Quantiles(0), Outlier Box Plot( 0 ) ) ) ) ); |
And here are some example results:
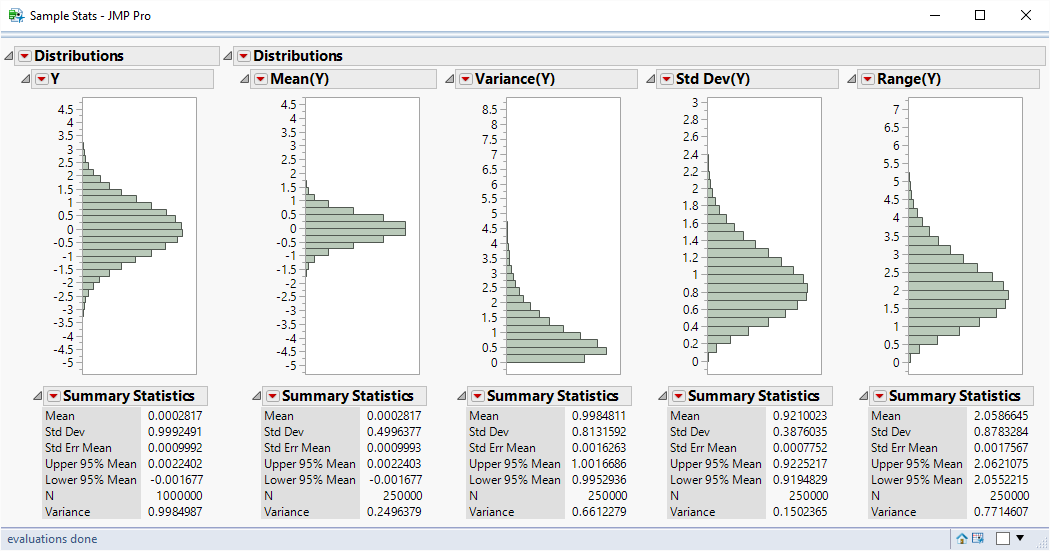
Notice that the average value for the range is 2.059. That is in agreement with the d2 value for a subgroup size of 4. I’m not sure what I expected the distribution of range to look like, but I didn’t expect it to look so similar to the standard deviation distribution. It really looks like standard deviation scaled by a factor of 2!
Why Not Just Compute Standard Deviation?
In this day and age of computers we should be able to avoid using lookup values by calculating the standard deviation directly instead of deriving it from the range.
But there is a problem. Take a look at the distribution for standard deviation. The average value of the standard deviation is 0.921. It should be 1.
In statistical theory we talk a lot about unbiased estimators:
” the average of a sample of data gives an
unbiased estimate of the population mean “
” the sample variance (based on the use of N-1
term in the denominator) yields an unbiased
estimate of the variance of the population “
An estimate is unbiased if, on average, the sample value agrees with the population value.
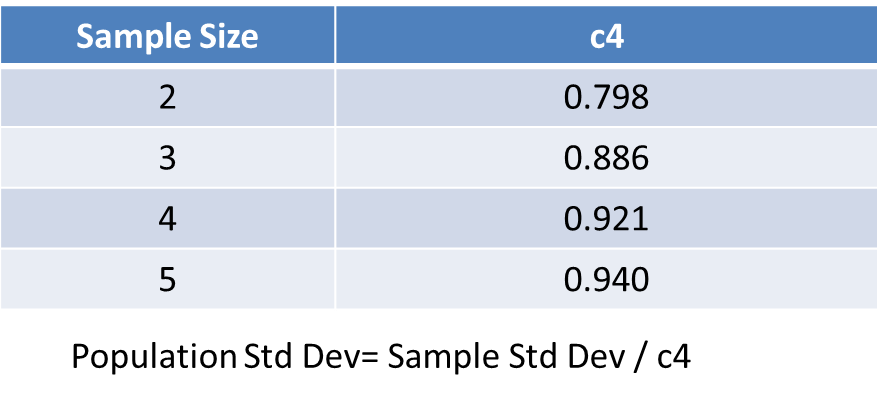
standard deviation is not an unbiased estimator
The data generated from the JSL script is demonstrating that standard deviation is not an unbiased estimator!
So using standard deviation instead of range doesn’t remove the need for a look up table. The table below shows the adjustments required to generate an unbiased estimate:
Stora webbplats! Det ser mycket professionell ! Underhåll den hjälp arbete !