This is the fourth step in building the oneway advisor.
It’s time to start developing the code that will check the assumptions of the oneway analysis. The first assumption is that data within each level of the grouping variable are normally distributed.
To be technically correct, this isn’t a true assumption of the analysis but it is a useful diagnostic, particularly if the second assumption (normally distributed residuals) in not valid. The assumption will be tested by using a function Test Normal Each Level. This is a user-defined function that has not yet been written!
Creating and using the function is the theme of this step.
Using JMP to Walk-Through Code Logic
In order to write code to implement the function Test Normal Each Level we need to understand how the test would be performed interactively using JMP.
For test purposes I am going to use the sample data table Big Class. The Y variable will be weight and the X variable will be sex. To test the distributions of the data within each level of the X variable I can use the By role within the Distribution platform:
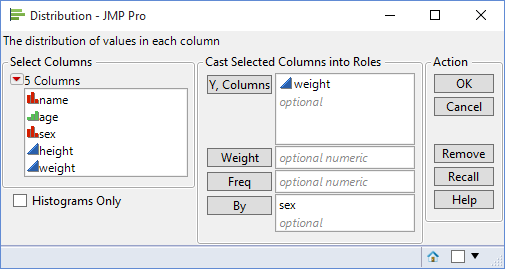
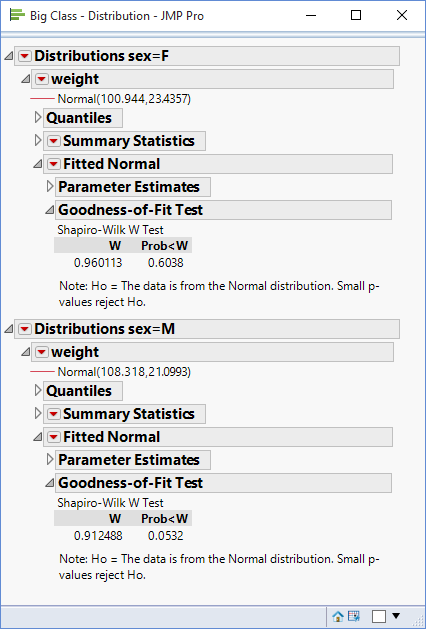
This will produce separate distributions for the two levels of sex – ‘F’ and ‘M’. For each of these levels the option Continuous Fit>Normal can be used to fit a normal distribution and then the option Goodness of Fit can be used to calculate the associated p-values:
JMP Generated Code
Associated with these steps is a JSL script which can be written as:
|
1 2 3 4 5 6 7 8 9 |
Distribution( Continuous Distribution( Column( :weight ), Fit Distribution( Normal( Goodness of Fit( 1 ) ) ) ), By( :sex ), ); |
Extracting Report Output
The above script will generate the required output – but what we need to do is to unpick the output and isolate the p-values. The first step in doing this is to reference the report window, which I can illustrate with the following code:
|
1 2 3 4 5 6 7 8 9 10 11 12 13 14 15 |
dist = Distribution( Continuous Distribution( Column( :weight ), Fit Distribution( Normal( Goodness of Fit( 1 ) ) ) ), By( :sex ), ); reportWindows = dist << Report; For (i=1,i<=NItems(reportWindows),i++, rep = reportWindows[i]; title = rep << Get Title; show(title) ); |
This produces the following log-window output:
![]()
Using the Word Function to Split Text
The variable reportWindow is a list of display boxes – this is because of the By-clause used to generate the distributions. The Word function can be used to extract the level from the title:
|
1 |
level = Word(2,title,"="); |
Referencing the Report’s Display Tree
For each level the p-value needs to be retrieved from the Goodness of Fit test. The following notation references this portion of the report:
|
1 |
gof = rep["Goodness-of-Fit Test"]; |
The p-value is the first item in the second column of a Table Box:
|
1 2 3 |
ncb = gof[NumberColBox(2)]; stats = ncb << Get; pValue = stats[1]; |
Constructing an Associative Array
The levels and p-values can be combined into a single data structure – an associative array:
|
1 2 |
arr = Associative Array(); arr[level] = pValue; |
Putting It All Together
The mechanics of the user-defined function Test Normal Each Level have now been established. Here is the full implementation, which should be created in a new script file called Analysis Components.jsl:
|
1 2 3 4 5 6 7 8 9 10 11 12 13 14 15 16 17 18 19 20 21 22 23 24 25 26 27 28 |
Test Normal Each Level = Function({dt,yCol,xCol},{Default Local}, dist = dt << Distribution( Continuous Distribution( Column( Eval(yCol) ), Fit Distribution( Normal( Goodness of Fit( 1 ) ) ) ), By( Eval(xCol) ), ); reportWindows = dist << Report; arr = Associative Array(); For (i=1,i<=NItems(reportWindows),i++, rep = reportWindows[i]; title = rep << Get Title; level = Word(2,title,"="); gof = rep["Goodness-of-Fit Test"]; ncb = gof[NumberColBox(2)]; stats = ncb << Get; pValue = stats[1]; arr[level] = pValue; ); dist << Close Window; Return(arr); ); |
Testing the Function
You can test the function by temporarily adding the following three lines and running the script:
|
1 2 3 |
dt = Current Data Table(); arrPValues = Test Normal Each Level(dt,"weight","sex"); show(arrPValues); |
The (JMP Log window) output should look like this:
![]()
Including The External JSL File
Now that the user-defined function has been developed and tested it can now be incorporated into the main code. First it needs to be “included”. Modify the script step3.jsl and add an additional include statement as indicated below:
|
1 2 3 4 5 6 7 8 |
Names Default To Here(1); // Include files Include("Filepath Definitions.jsl"); Include("Analysis Components.jsl"); // Namespaces nsICONS = Get Icons Namespace(); |
Invoking the Function
At the end of the file, after the new window has been created for the oneway advisor, add the code required to invoke the new function and process the results:
|
1 2 3 4 5 6 7 8 9 10 |
// Check assumptions alpha = 0.05; dt = Data Table(dtName); arrPValues = Test Normal Each Level(dt,yColName,xColName); minPValue = Min( arrPValues<<Get Values ); If (minPValue<=alpha, btnNormalLevels << Set Icon(nsICONS:FAIL_ICON) , btnNormalLevels << Set Icon(nsICONS:PASS_ICON) ); |
Referencing the Icon Buttons
Our user function generates a p-value for each level. If the smallest of these is less than the alpha level of 0.05 then the icon for this test is set to FAIL, otherwise it is set to PASS. This code assumes that the button containing the icon is called btnNormalLevels. The portion of code that contains the button definition needs to be revised to contain the button name:
|
1 2 3 4 5 6 7 8 9 10 |
LineUpBox(NCol(2), Spacing(30,20), Text Box("Data within each level of the grouping variable are normally distributed",<<Set Wrap(wrapSize)), btnNormalLevels = Button Box( "",,<<Set Icon(nsICONS:READY_ICON)), Text Box("Residuals are normally distributed",<<Set Wrap(wrapSize)), Button Box( "",,<<Set Icon(nsICONS:READY_ICON)), Text Box("Data within each level of the grouping variable have equal variance",<<Set Wrap(wrapSize)), Button Box( "",,<<Set Icon(nsICONS:READY_ICON)), Text Box("The data are independent, exhibiting no serial correlation",<<Set Wrap(wrapSize)), Button Box( "",,<<Set Icon(nsICONS:READY_ICON)), ) |
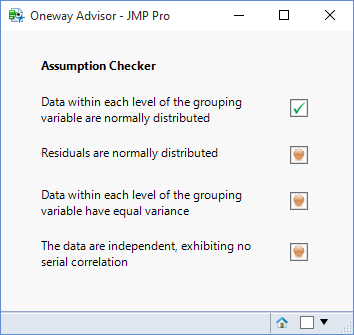
Running the revised code should display a pass or fail icon for the first test, depending on the data being used:
In future steps we will want to reference the other buttons so now is a good time to name all the buttons:
- btnNormalLevels
- btnNormalResids
- btnEqualVariance
- btnIndependentData
|
1 2 3 4 5 6 7 8 9 10 |
LineUpBox(NCol(2), Spacing(30,20), Text Box("Data within each level of the grouping variable are normally distributed",<<Set Wrap(wrapSize)), btnNormalLevels = Button Box( "",,<<Set Icon(nsICONS:READY_ICON)), Text Box("Residuals are normally distributed",<<Set Wrap(wrapSize)), btnNormalResids = Button Box( "",,<<Set Icon(nsICONS:READY_ICON)), Text Box("Data within each level of the grouping variable have equal variance",<<Set Wrap(wrapSize)), btnEqualVariance = Button Box( "",,<<Set Icon(nsICONS:READY_ICON)), Text Box("The data are independent, exhibiting no serial correlation",<<Set Wrap(wrapSize)), btnIndependentData = Button Box( "",,<<Set Icon(nsICONS:READY_ICON)), ) |
Creating Button Tooltips
Finally I want to button to convey information when the mouse “hovers” over the icon. This is achieved by assigning a “tip” to the button:
|
1 2 3 4 5 6 |
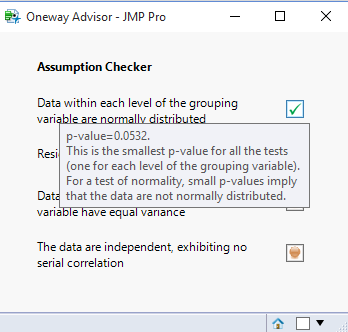
strTip = "p-value=" || Char(Round(minPValue,4)) || ".\!N" || "This is the smallest p-value for all the tests \!N" || "(one for each level of the grouping variable). \!N" || "For a test of normality, small p-values imply \!N" || "that the data are not normally distributed."; btnNormalLevels << Set Tip(strTip); |
This is how the tip will appear to the user:
And Finally
This completes step 4! Make sure you save the revised code as step4.jsl. Here is what the file should look like:
|
1 2 3 4 5 6 7 8 9 10 11 12 13 14 15 16 17 18 19 20 21 22 23 24 25 26 27 28 29 30 31 32 33 34 35 36 37 38 39 40 41 42 43 44 45 46 47 48 49 50 51 52 53 54 55 56 57 58 59 60 61 62 63 64 65 66 67 68 69 70 71 72 73 74 75 76 77 78 79 80 81 82 83 84 85 86 87 88 |
Names Default To Here(1); // Include files Include("Filepath Definitions.jsl"); Include("Analysis Components.jsl"); // Namespaces nsICONS = Get Icons Namespace(); // Check that the current window is a oneway analysis isWinOpen = 0; cr = Current Report(); If (!IsEmpty(cr), winTitle = cr << Get Window Title; If (Contains(winTitle,"Fit Y by X") | Contains(winTitle,"Oneway"), isWinOpen = 1 ) ); If (!isWinOpen, New Window("Oneway Analysis Not Found", <<Modal, Border Box(Top(20),Bottom(20),Left(20),Right(20), V List Box( Text Box("Unable to find a window containing"), Text Box("a oneway analysis of variance") ) ) ); Throw() ); // Determine the variables associated with the analysis obTitle = cr[Outline Box(1)] << Get Title; pat = PatArb()>>dtName + " - " + PatAltern("Fit Y by X","Oneway") + " of " + PatArb()>>yColName + " by " + PatRem()>>xColName; success = Pat Match(winTitle,pat); If (!success, New Window("Error Inspecting Oneway Window", <<Modal, Border Box(Top(20),Bottom(20),Left(20),Right(20), V List Box( Text Box("Unable to determine the variables used"), Text Box("to construct the oneway analysis") ) ) ); Throw() ); // Main window wrapSize = 220; New Window("Oneway Advisor", Show Menu( 0 ), Show Toolbars( 0 ), Border Box(Top(20),Bottom(20),Left(10),Right(10), V List Box( H List Box( Spacer Box(Size(30,0)), Text Box("Assumption Checker",<<Set Font Style("Bold")) ), LineUpBox(NCol(2), Spacing(30,20), Text Box("Data within each level of the grouping variable are normally distributed",<<Set Wrap(wrapSize)), btnNormalLevels = Button Box( "",,<<Set Icon(nsICONS:READY_ICON)), Text Box("Residuals are normally distributed",<<Set Wrap(wrapSize)), btnNormalResids = Button Box( "",,<<Set Icon(nsICONS:READY_ICON)), Text Box("Data within each level of the grouping variable have equal variance",<<Set Wrap(wrapSize)), btnEqualVariance = Button Box( "",,<<Set Icon(nsICONS:READY_ICON)), Text Box("The data are independent, exhibiting no serial correlation",<<Set Wrap(wrapSize)), btnIndependentData = Button Box( "",,<<Set Icon(nsICONS:READY_ICON)), ) ) ) ); // Check assumptions alpha = 0.05; dt = Data Table(dtName); arrPValues = Test Normal Each Level(dt,yColName,xColName); minPValue = Min( arrPValues<<Get Values ); If (minPValue<=alpha, btnNormalLevels << Set Icon(nsICONS:FAIL_ICON) , btnNormalLevels << Set Icon(nsICONS:PASS_ICON) ); strTip = "p-value=" || Char(Round(minPValue,4)) || ".\!N" || "This is the smallest p-value for all the tests \!N" || "(one for each level of the grouping variable). \!N" || "For a test of normality, small p-values imply \!N" || "that the data are not normally distributed."; btnNormalLevels << Set Tip(strTip); |
One thought on “Checking Distributions Within Group Levels”